
Comparable measurements
Parent and child consumption from the same measurement window reduces timing-related uncertainty.
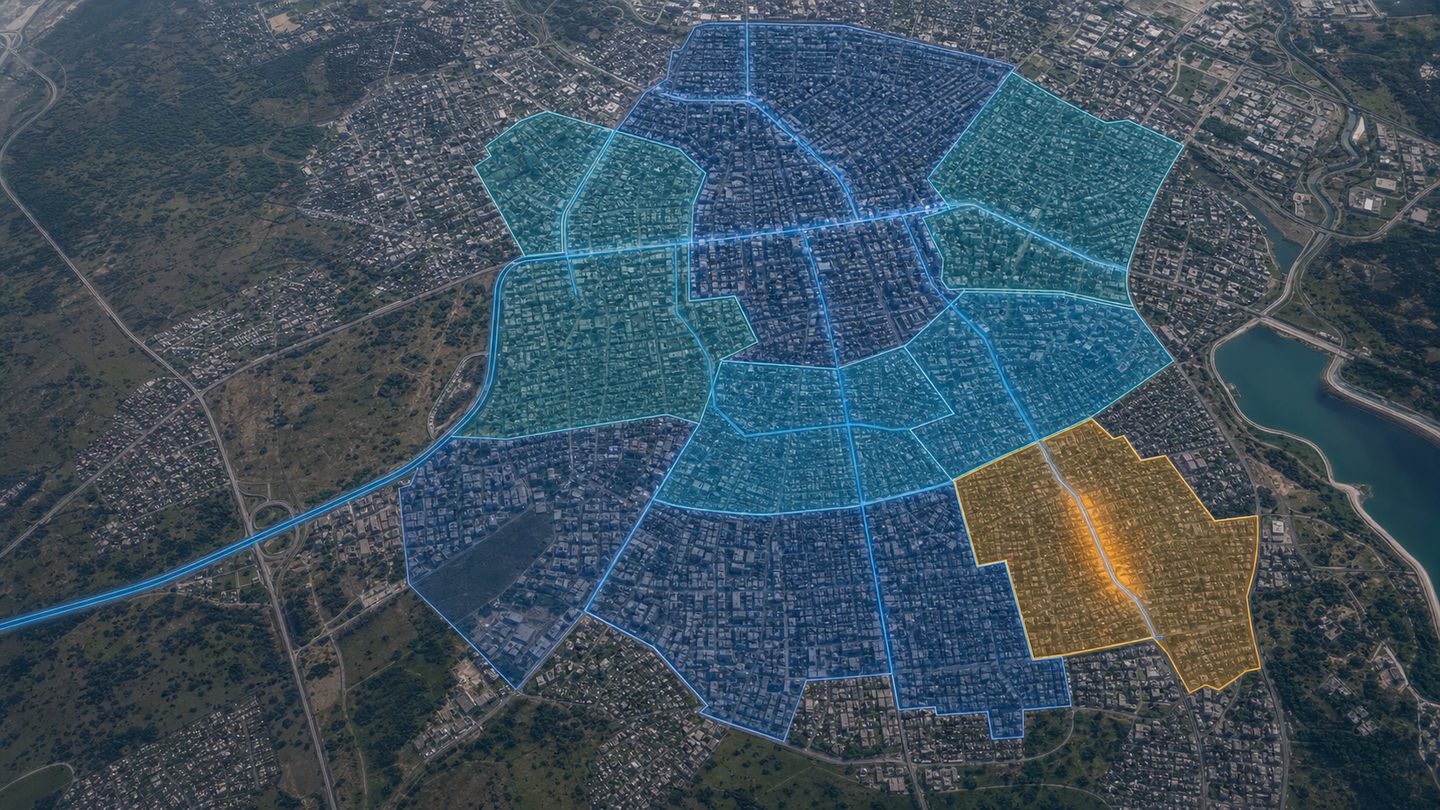
Orion-Powered Hierarchical DMA
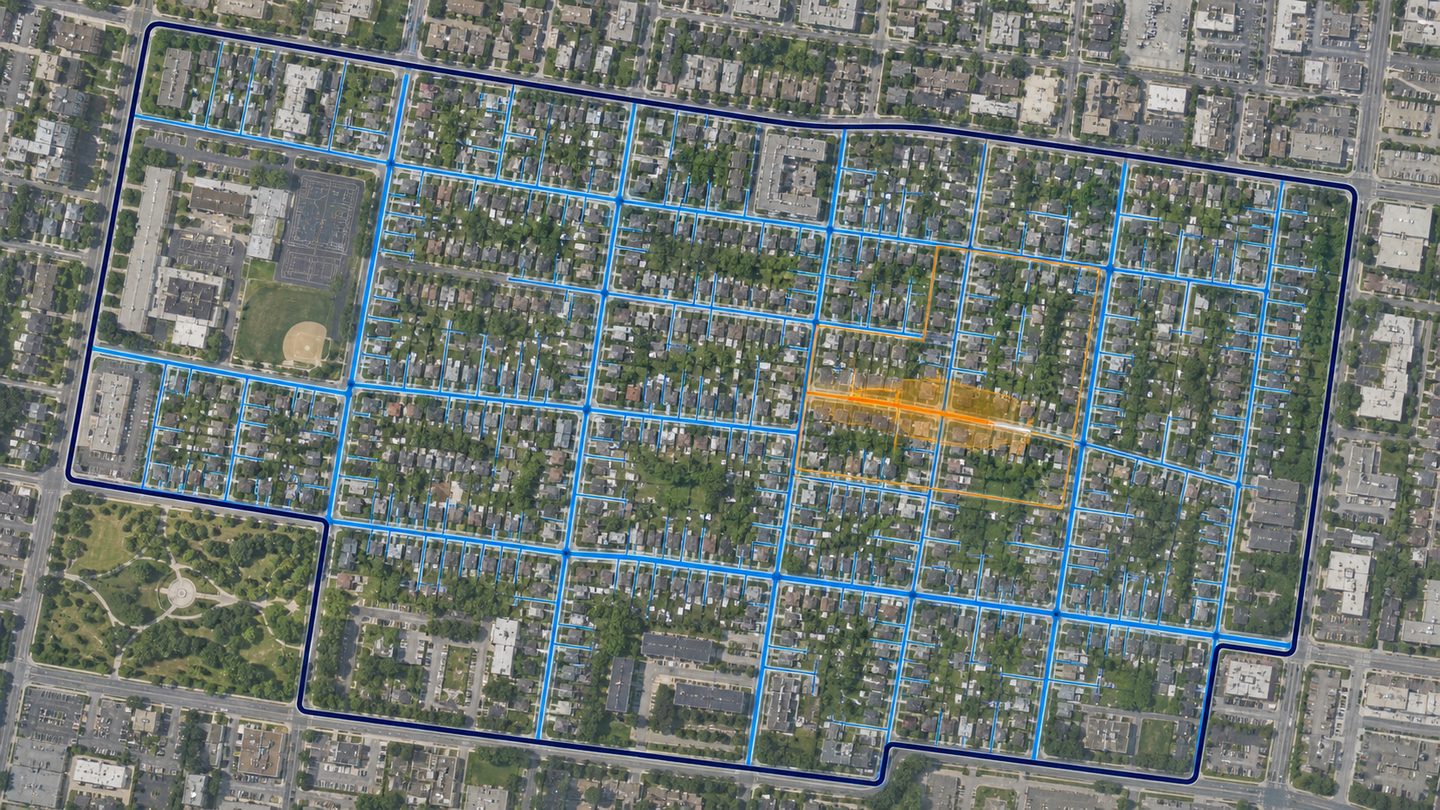
Build connected metering zones from the main inlet to the customer meter. Compare Orion consumption or index data from the same calculation cut-off and narrow unexplained differences through the network, one level at a time.
Measure at the same moment. Compare at every level. Focus on the right area.
The problem is not simply missing data
If the main inlet is read in the morning, neighborhood meters in the afternoon and customer meters on another day, the difference carries more than water loss—it also carries a timing mismatch. A comparable water balance needs data from the same measurement window at every level.
A sound comparison begins with a shared time reference.
Readings belong to different moments: the difference also carries a timing shift.
Every level shares one calculation cut-off: the difference becomes comparable.
The method
At the configured calculation cut-off, Orion meters store consumption for the completed period and, if required, the closing index. This creates a comparable consumption snapshot across the network hierarchy.
Compare district inlets with neighborhood inlets, and neighborhood inlets with customer meters. Account for defined operational use and necessary field adjustments to reveal the difference that needs investigation.
Move the investigation to the district, neighborhood or customer cluster where the difference persists. Direct field teams to a data-led priority zone instead of the entire network.
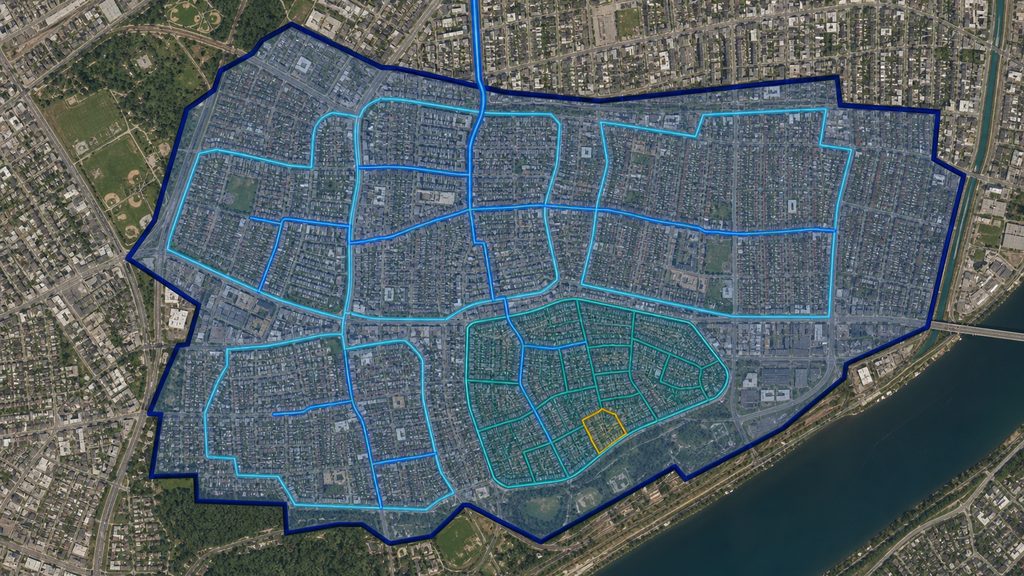
A model with extensible depth
A meter can be the parent of other meters, while its children can feed zones of their own. City, district, neighborhood and customer are only one example. Industrial zones, campuses, residential sites, buildings and irrigation lines can use the same parent–child model.
The number of levels follows your operational needs; the names in this example are illustrative only.
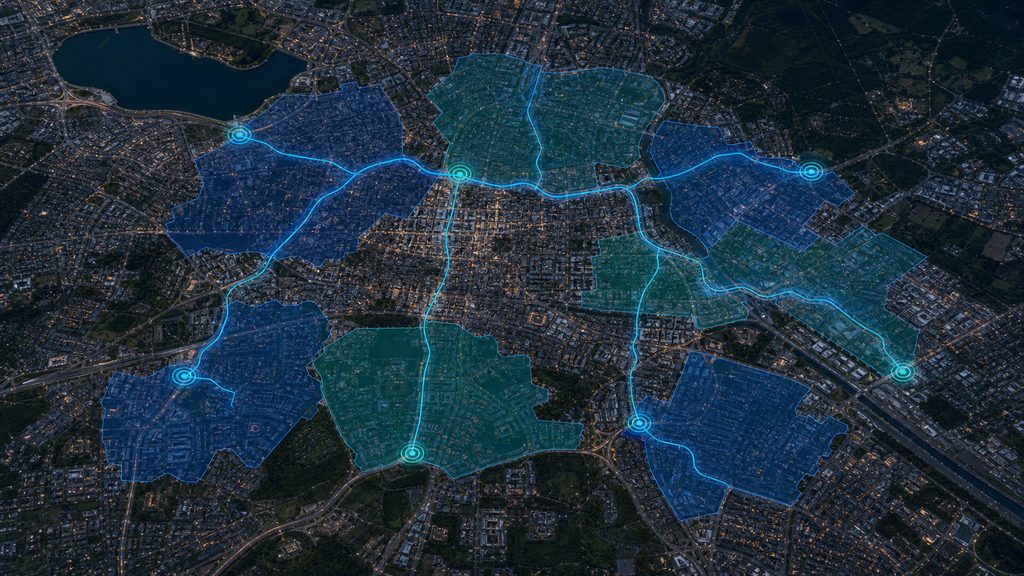
The Orion metering approach
When period consumption values refer to the same calculation cut-off, parent and child meters speak within the same measurement window. This common reference reduces uncertainty caused by normal demand changes over the day.
Use stored period consumption directly, or derive consumption from the difference between closing indexes at two calculation cut-offs.
Missing or delayed meters, unit mismatches and meter replacement events must be considered alongside the calculated difference.
Zone water balance
See how much of the parent meter consumption is represented by its child meters. If the difference continues, move down one level; if the branch balances, evaluate another branch.
Simplified calculation
A difference is not proof of physical leakage on its own. Meter error, missing data, unauthorized consumption, undefined operational use, boundary transfers or storage changes can also create a difference.
Example scenario
The values below are illustrative and explain the method only.
The city inlet records 10,000 m³ of period consumption.
This is not a savings or leak-detection result. It demonstrates how hierarchical comparison works.
Operational value
Parent and child consumption from the same measurement window reduces timing-related uncertainty.
Follow the difference through the city, district, neighborhood and customer-cluster hierarchy to create a field priority.
Add new meters and subzones to the existing tree as the network grows.
Missing, delayed or incompatible readings stay visible in the analysis so decision confidence can be understood.
Hardware and data in one approach
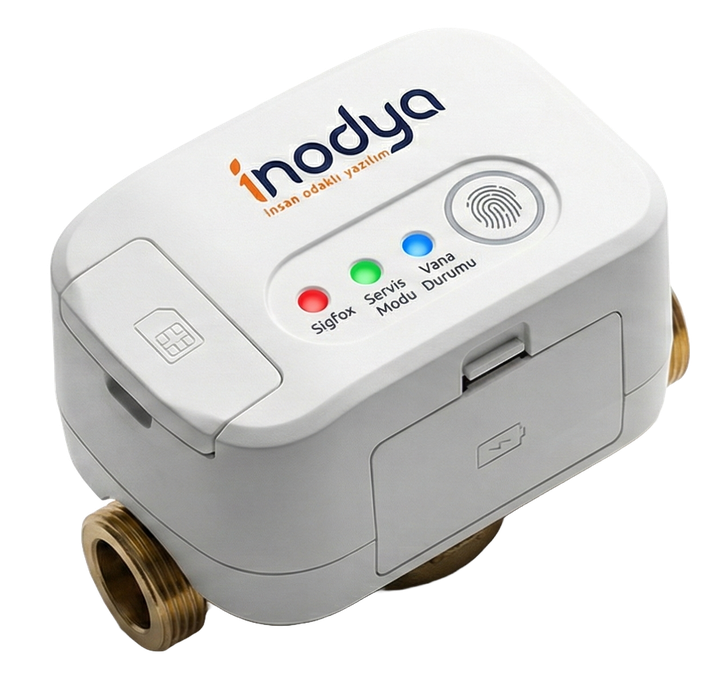
Orion stores consumption or a closing index at the configured cut-off, supporting a common comparison window across different network levels. The DMA model turns that data into parent–child context.
Published technical specifications must be verified by the product team.
Where does it create value?
Monitor large distribution systems regionally, from the main transmission inlet to districts and neighborhoods.
Compare consumption by facility, production line or tenant within a shared measurement window.
Manage campus inlet, building, block and customer-cluster levels in one hierarchy.
Divide consumption from the main channel or line into downstream distribution branches.
Knowledge center
Learn what a DMA is, why boundaries matter and how a hierarchy extends conventional zoning.
Read the article 02See how readings taken at different times affect a water balance and what a shared calculation cut-off improves.
Read the article 03Understand the distinction between real loss, apparent loss, incomplete data and operational consumption.
Read the articleFrequently asked questions
A District Metered Area is a defined section of a water network whose inlets—and outlets where applicable—are measured so its water balance can be monitored. İnodya connects these areas across multiple levels using parent–child meter relationships.
To understand where a difference inside a large area originates, the same comparison must be repeated in smaller zones. A hierarchy supports a progressive move from city to district, neighborhood and smaller clusters.
It gives parent and child meters consumption or index data for the same measurement window, reducing uncertainty introduced by comparing different moments of demand.
Not necessarily. In addition to physical leakage, meter accuracy, missing or delayed data, unauthorized use, undefined authorized use, boundary transfers and storage-level changes may create a difference. The result is an investigation signal.
Because the model is based on parent–child meter relationships, additional levels can be introduced as required. Product-scale limits must be verified by the product team.
The central proposition on this website is Orion's ability to produce data for a shared calculation cut-off. Support for other meter or data sources depends on the verified integration scope.
Let us model your network together
Review your main inlet, subzones and customer clusters with us. We can define the metering boundary and shared calculation-cut-off approach for your existing infrastructure.