
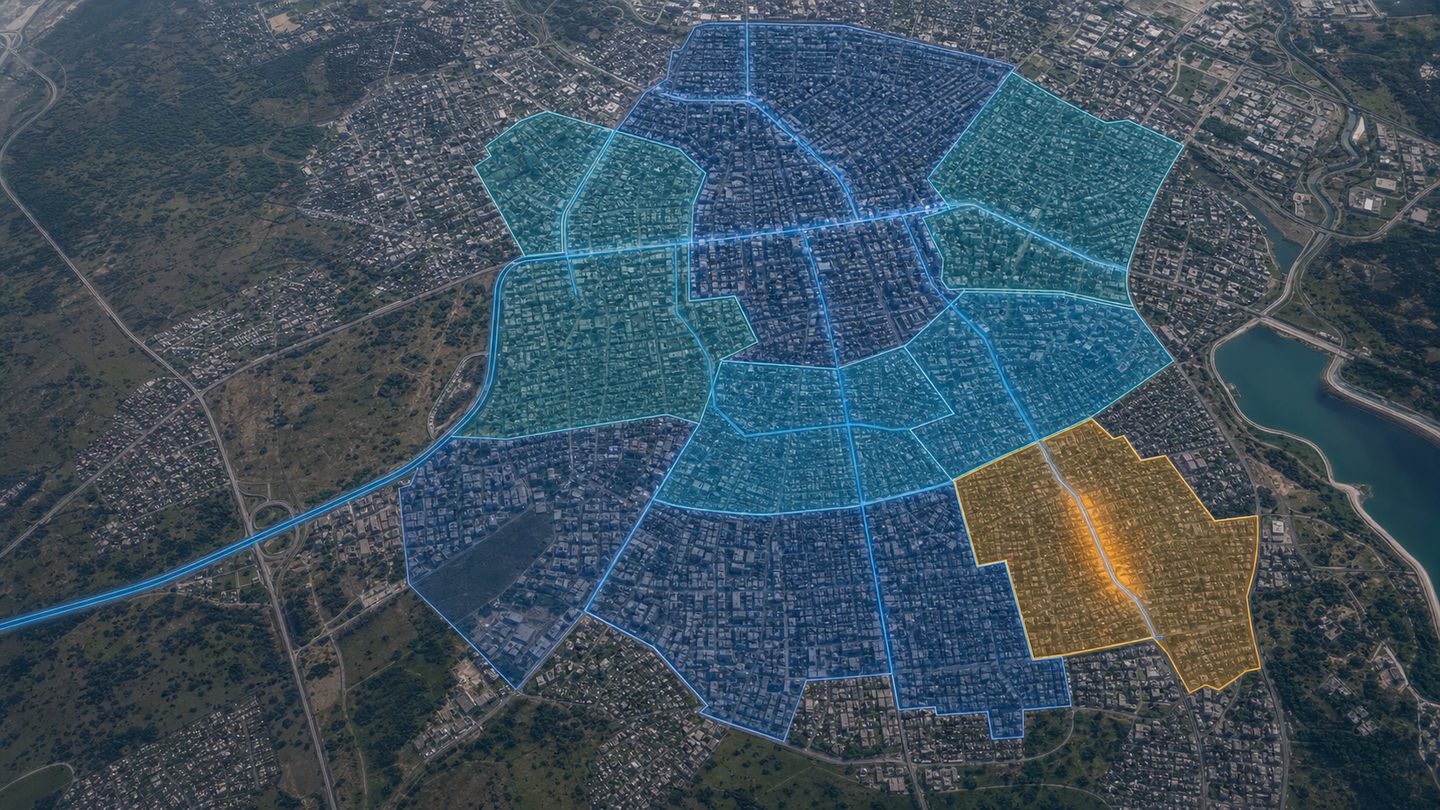
Divide a large network into manageable zones.
Compare consumption from the city inlet down to districts and neighborhoods within one hierarchy. Turn the zone where the difference persists into a smaller field work order.
Use cases
Any distribution network that can be described with parent–child meter relationships can be modelled hierarchically. The areas below are the most common applications.
Compare consumption from the city inlet down to districts and neighborhoods within one hierarchy. Turn the zone where the difference persists into a smaller field work order.
Model the industrial zone inlet, blocks, facilities and production areas with parent–child relationships, and separate shared consumption from unexplained differences.
Compare the campus or estate inlet with building and block meters. Define common-area consumption to see which structure the difference continues in.
Connect the main line, secondary channels and user groups hierarchically, and review seasonal distribution differences by zone.
A difference is not proof of physical leakage on its own. Meter error, missing data, unauthorized consumption, undefined operational use, boundary transfers or storage changes can also create a difference.
Let us model your network together
Review your main inlet, subzones and customer clusters with us. We can define the metering boundary and shared calculation-cut-off approach for your existing infrastructure.